AMC 8 1985 Problem 5
AMC8 1985 年第 5 题
统计与数据图表★☆☆☆☆
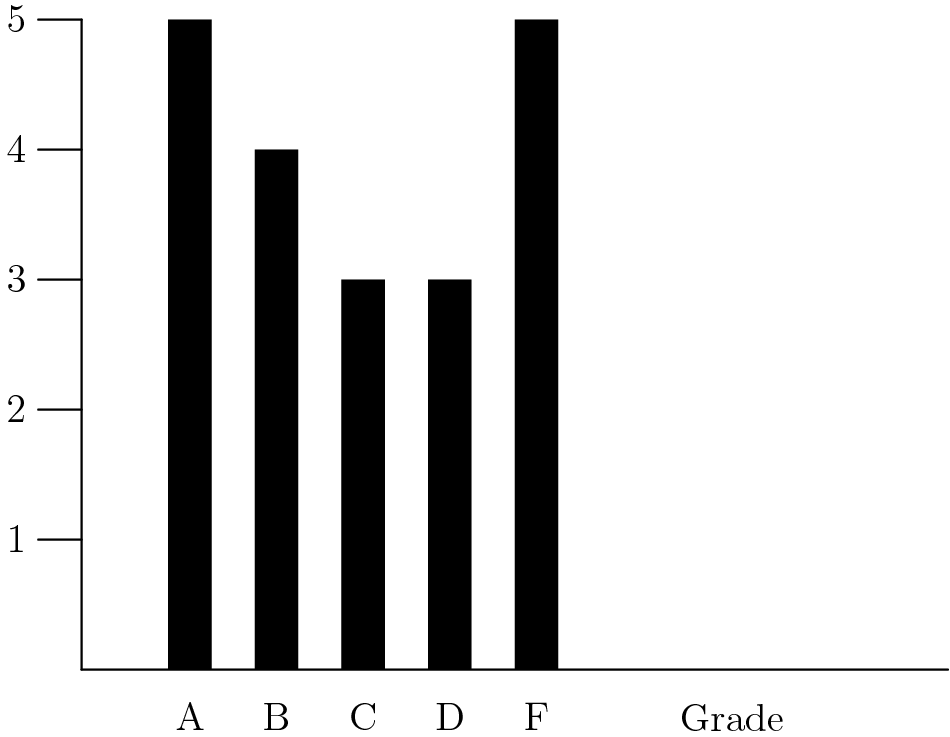
The bar graph shows the grades in a mathematics class for the last grading period. If A, B, C, and D are satisfactory grades, what fraction of the grades shown in the graph are satisfactory?
柱状图显示了一个数学班上个评分周期的成绩。如果 A、B、C 和 D 是及格成绩,图表中显示的及格成绩占几分之几?
- A.
- B.
- C.
- D.
- E.
正确答案 · Correct Answer
C
解析 · Solution
解析整理中
继续练习