AMC 8 1993 Problem 10
AMC8 1993 年第 10 题
统计与数据图表★☆☆☆☆
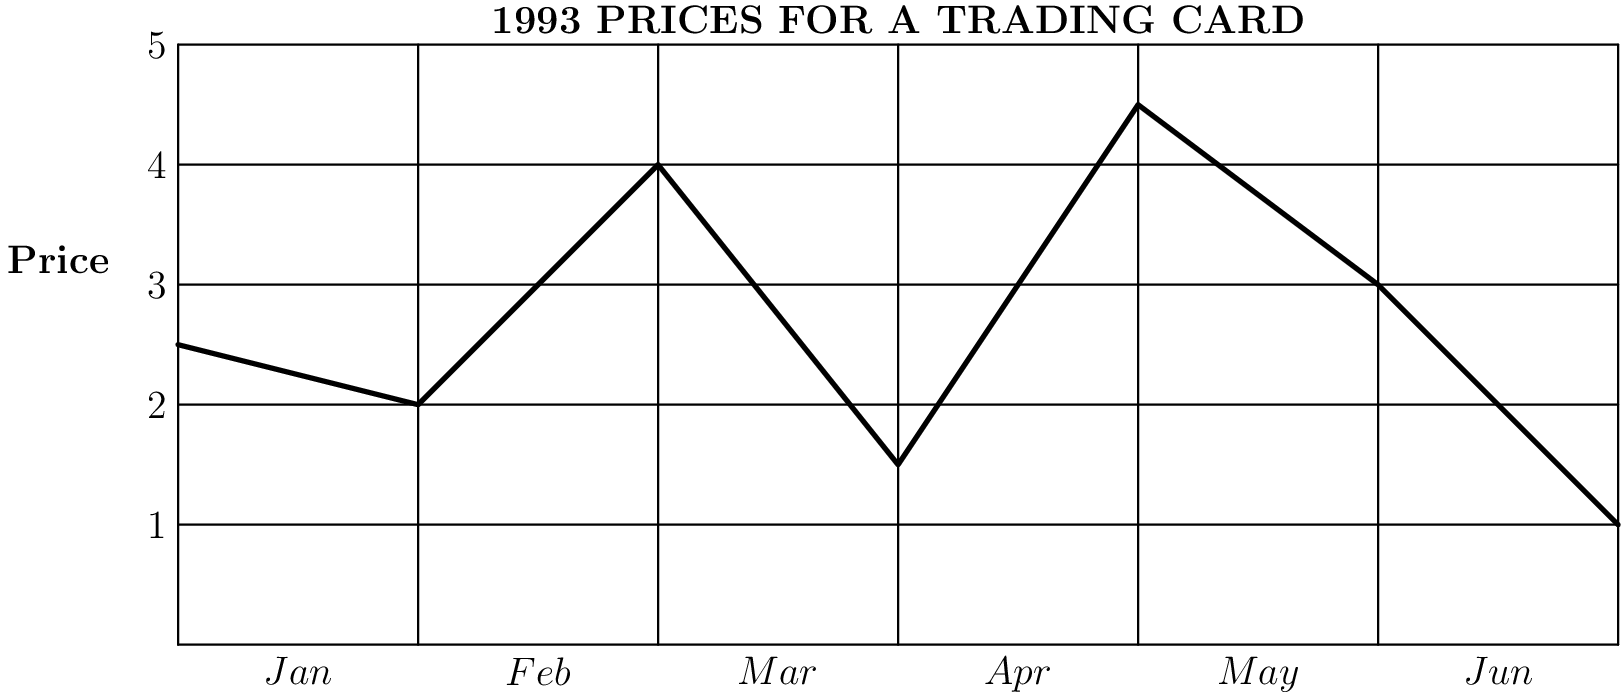
Problem This line graph represents the price of a trading card during the first 6 months of $1993$. The greatest monthly drop in price occurred during
此折线图表示了 1993 年前 6 个月一张交易卡的价格。 价格月跌幅最大的是在
- A.
- B.
- C.
- D.
- E.
正确答案 · Correct Answer
B
解析 · Solution
解析整理中
继续练习